
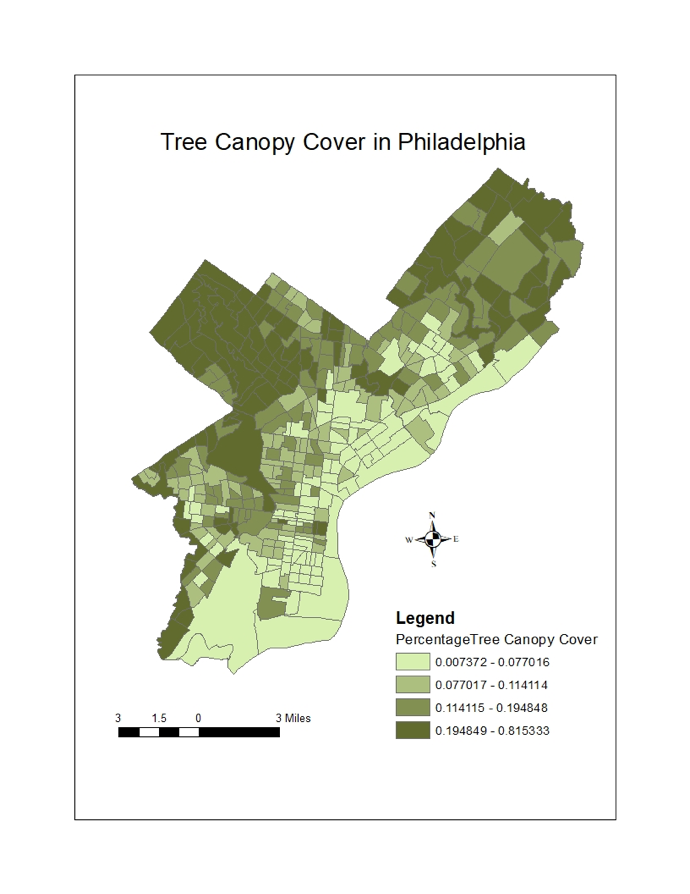
About: I used ArcMap to create this choropleth map displaying the percentage of land in each census tract that is covered by tree canopy in my 2018 Urban GIS course.
Data: The Philadelphia Land Cover Raster from 2008 with data regarding tree canopy and other land use types was retrieved from Open Data Philly. The shapefile of Philadelphia Census Tracts was retrieved from the U.S. Census Bureau.
Methods: The landcover raster data displays numerous land cover types in Philadelphia via coded pixels. For my purposes of analyzing tree canopy, I simplified it. I did so by reclassifying the raster file into a binary so that tree canopy was coded as 1 and all other land cover categories were coded as 0. To find the percentage of each census tract that was tree canopy, I utilized zonal statistics as table to find the count and sum of pixels in each census tract. The count tells us the total number of pixels in each census tract (the total area), while the sum tells us the number of pixels that are tree canopy because they are coded as 1 while the rest are coded as 0. I then added a new field in the attribute table and calculated the percentage tree canopy cover in each census tract by dividing sum by count. I used quantile classification to divide the census tracts into four groups based on percentage of tree canopy cover, from least tree canopy to most.