
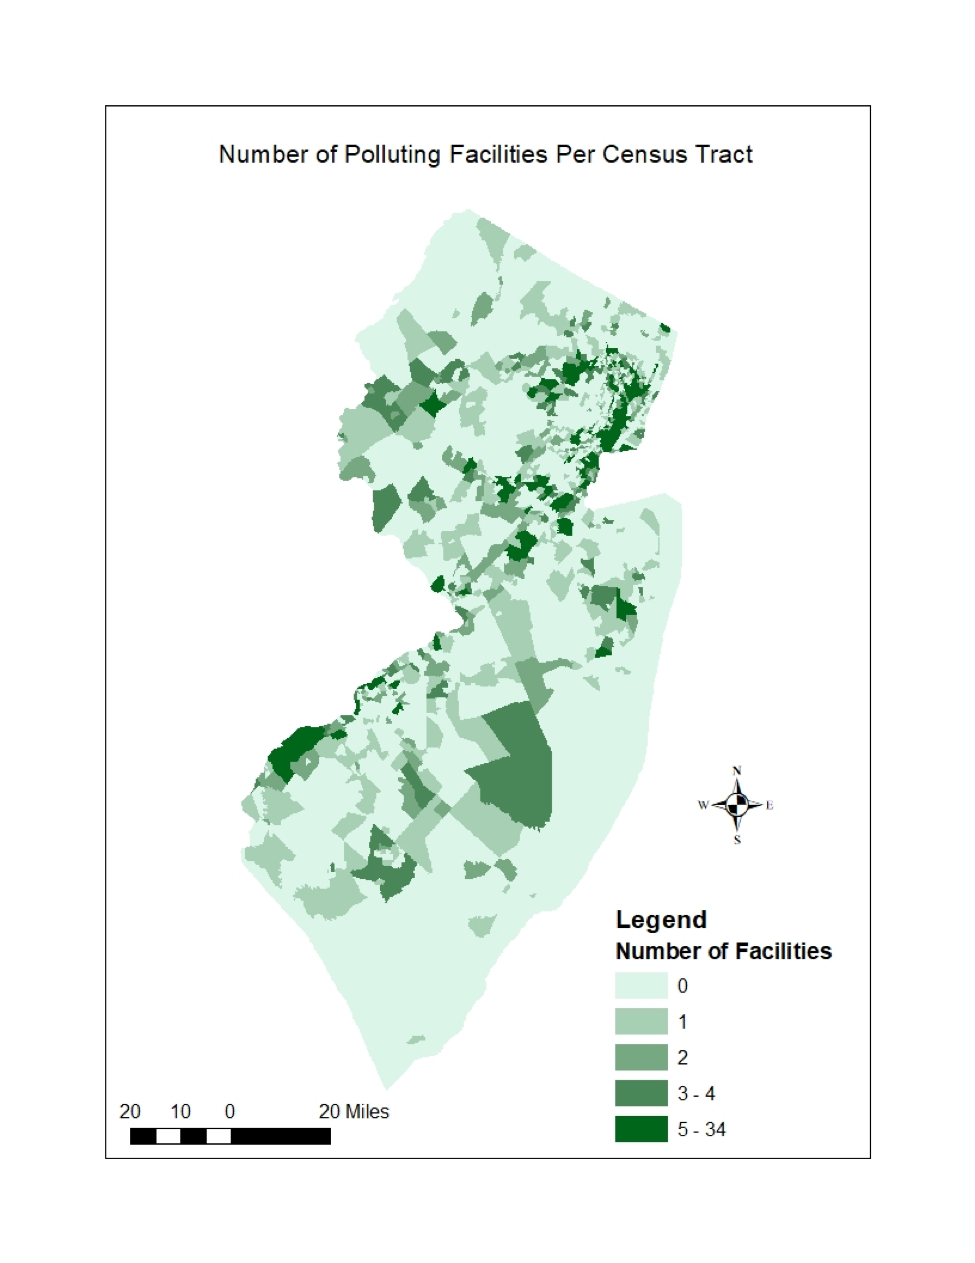
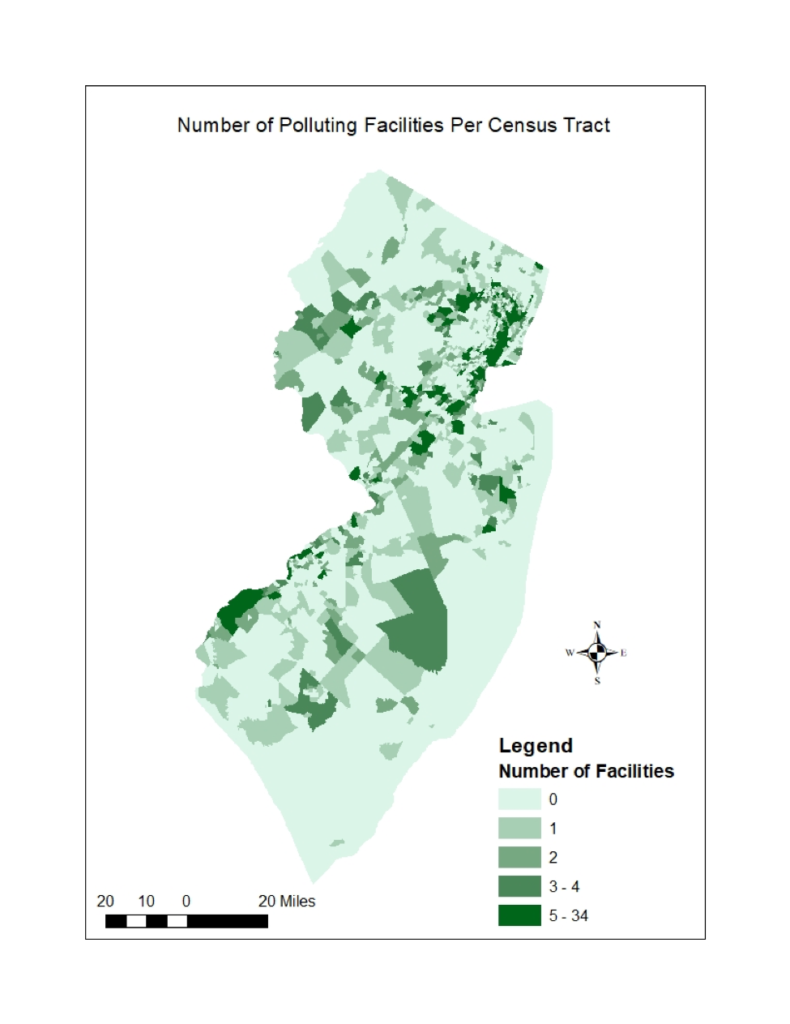
About: I used ArcMap to create this map for my 2018 course in Urban GIS. It utilizes a simple choropleth design to show the number of polluting facilities in each census tract of New Jersey.
Data: Data on air polluting facilities in New Jersey were captured by the EPA’s publicly available Toxic Release Inventory Database and retrieved from the Toxmap web application, a development of the National Institute of Health.
Methods: I performed a spatial join between the polluting facilities point data and the census tracts shapefile layer to get a simple count of how many facilities there were in each tract.