
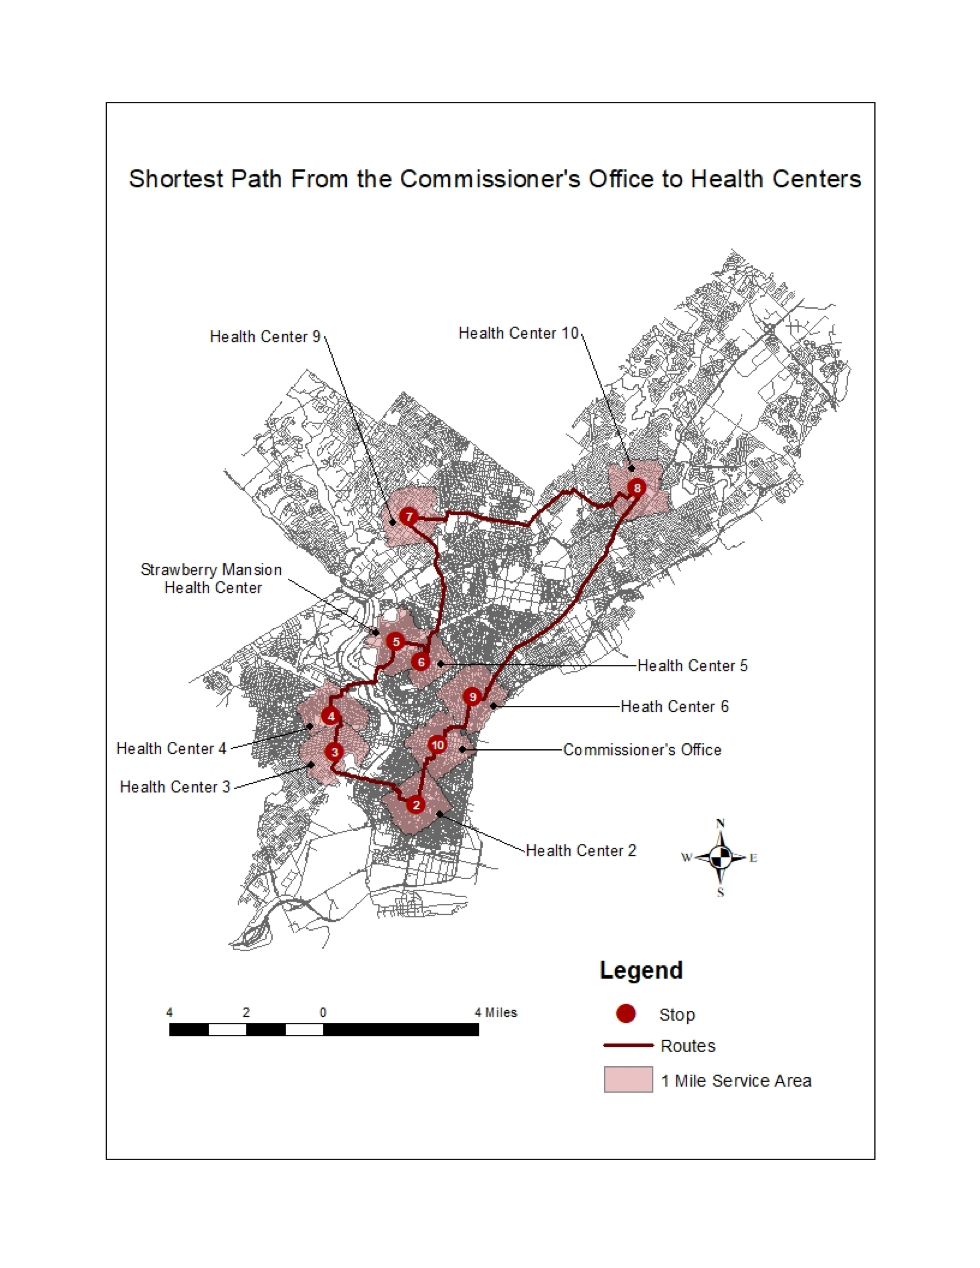
About: I created this map via ArcMap in my 2018 Urban GIS course. The purpose of this lab was to map the distribution of public health centers in Philadelphia, Pennsylvania. I also determined an ideal route between these centers that started and ended at the Health Commissioner’s Office and minimized overall travel distance. I also identified a 1 mile service area for each health center based on the street network to more accurately portray the route taken by a city traveler, as well as their geographic access, than a buffer showing Euclidean distance would.
Data: The data from this lab included the addresses of the Public Health Centers in Philadelphia, as well as the address of the Commissioner’s Office. This data was retrieved from the City of Philadelphia Department of Public Health web site. The Philadelphia streets data was retrieved from the Pennsylvania Spatial Data Access website and the street centerlines were used for the purpose of geocoding and service area analysis.
Methods:
The first step in this lab was to geocode the addresses of the health centers and the Commissioner’s Office. By geocoding we generate a mapped coordinate location based on a text-encoded location. In this case the text-encoded location was a CSV of the names, zip codes, and addresses we wanted to include in this analysis. We specifically used address geocoding to generate a mapped location in a coordinate system from text-encoded street addresses.
Before we could geocode we needed to create an address locater, utilizing the Philadelphia street centerlines data as our reference data so the system has enough geographical context to match up the addresses with their real-world location. Using the newly created Philly address locater and the address CSV as our inputs, we continued with the geocoding process and ended up with 100% of the matches, making rematching unnecessary.
Moving on, we began to use the network analyst tools. A network can be defined as a set of nodes that are connected by links, with each link representing a cost in terms of distance. This differs from Euclidean distance or buffer operations because in this network analysis we are examine connectivities and the relationships between locations based on a street system. The insertion of nodes allows the system to compute how the locations are connected to each other via edges. Using this process, we are able to conduct a shortest path analysis that had the least “cost” in terms of distance between the travelled nodes. We also used network analyst tools to conduct a route that represents our least costly path.
In order to begin this process we needed to create a network dataset using the centerlines as the reference data again, adding the dataset and the junctions to the map. From here we created the new service areas around the health centers by loading our point locations as the facilities, and setting the parameters as 1-mile in network space. We then created a route between these facilities by defining the stops as the health centers and Commissioner’s Office. The Commissioner’s Office served as the preserved first and last stop and we reordered to rest to find the most optimal route.