

About: I created these maps via ArcMap in my 2018 Urban GIS course. Using geographic methods and the network analyst tool, they propose a logical location for a new health center that will increase accessibility for the impoverished.
Data: The data from this lab included the addresses of the Public Health Centers in Philadelphia, as well as the address of the Commissioner’s Office. This data was retrieved from the City of Philadelphia Department of Public Health web site. The Philadelphia streets data was retrieved from the Pennsylvania Spatial Data Access website and the street centerlines were used for the purpose of geocoding and service area analysis. Other data for this lab included spatial data on tracts boundaries in Philadelphia from the 2010 Census, obtained from the Census TIGER products page. I also worked with 2016 Census demographic data on poverty within Philadelphia census tracts, obtained from the American Factfinder website.
Methods:
In this lab we used network analysis capabilities and functionality, location allocation, and basic demographic analysis in GIS in order to fulfill our aforementioned objective of looking at poverty rates in the existing service areas and across Philadelphia to determine which geographic populations needed better access to a health center.
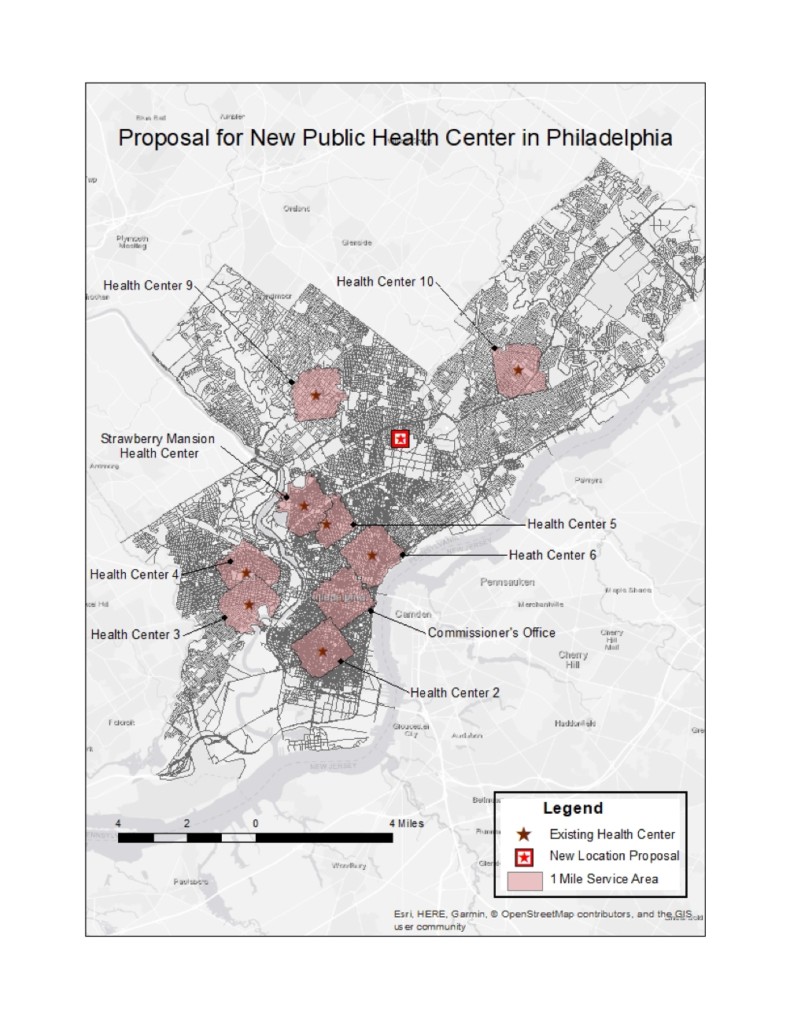
In order to find the poverty information on each service area, I first exported each service area polygon separately by selecting them from the attribute table and creating an individual layer out of each. I then used selection by location to find the census tracts that had their centroids within each service area feature class and exported this data to their own attribute tables which were further analyzed for the poverty information listed in the results section. Lastly, the poverty rate of each individual service area was found simply by dividing the number of people living below the poverty line by the total population. I manually found the centroids of the census tract polygons using “calculate geometry” within the attribute table of the feature class. First, I added fields for longitude and latitude in the attribute table. Then, I used the calculate geometry feature and found the X coordinate of centroid for longitude and Y coordinate of centroid for latitude. I exported these results to their own table and displayed the XY data of this table by making an XY Event layer. The centroids were also later utilized as demand points in the location allocation process.
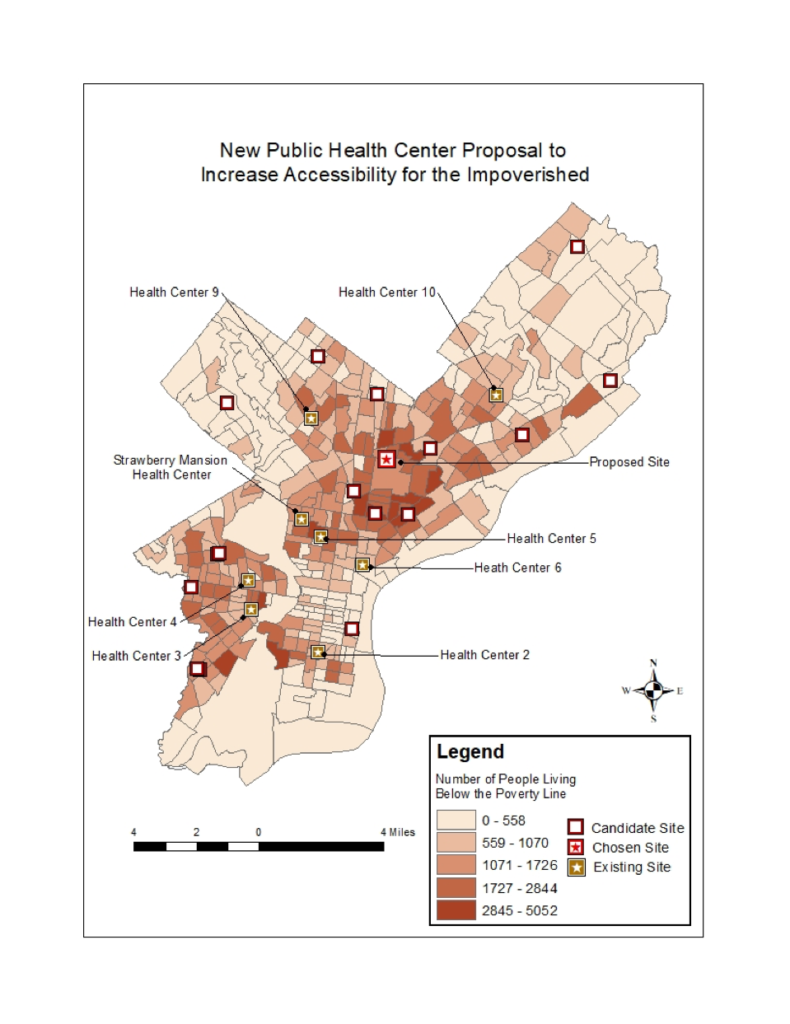
Rather than using a non-analytical method to place the new health center, I used network analyst to analytically find a place based on our input data and the Philadelphia street network. Location allocation allows us to find an optimal location for one or more new facilities using information about existing facilities, travel distance, and other factors. Without any other input information, network analyst will solve the location allocation by virtue of distance, using the street network to measure this. Our additional optimizing factor in this case was a measure of people living in poverty because we wanted to optimize our new location to be able to serve as many people living below the poverty line as possible. Our location allocation began with a set of randomly distributed points that would act as possible new locations for health centers. These acted as our candidate points. We also had a set of existing health centers, which can be thought of as our facilities. The existing facilities will continue to exist in the future regardless of a new site, therefore they were required in the location allocation solution. On the other hand, only one possible candidate site will be a part of the solution because we only want one more health center in this case. The solution of the location allocation was set to have nine facilities, the 8 existing plus one candidate that optimizes travel distance and impoverished people served simultaneously. To do this, distance was weighted by number of people living below the poverty line in each census tract.