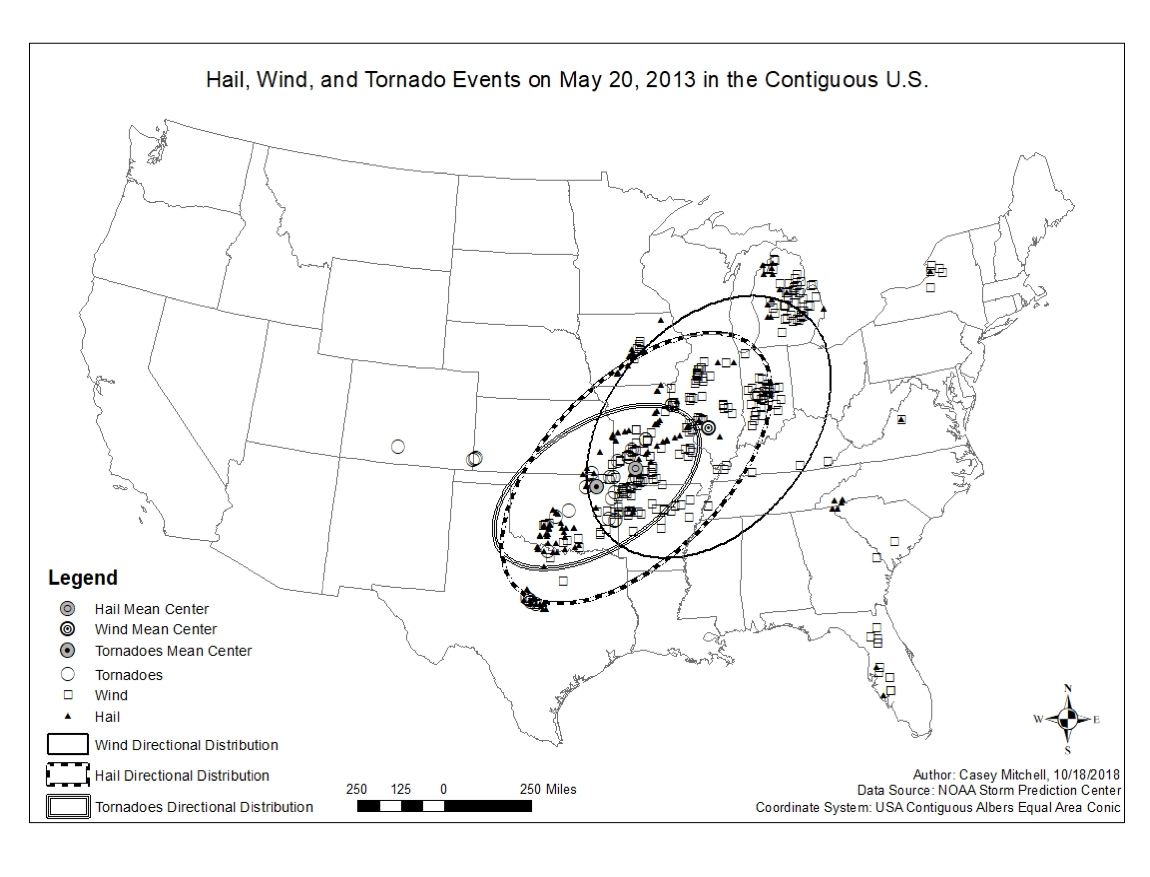
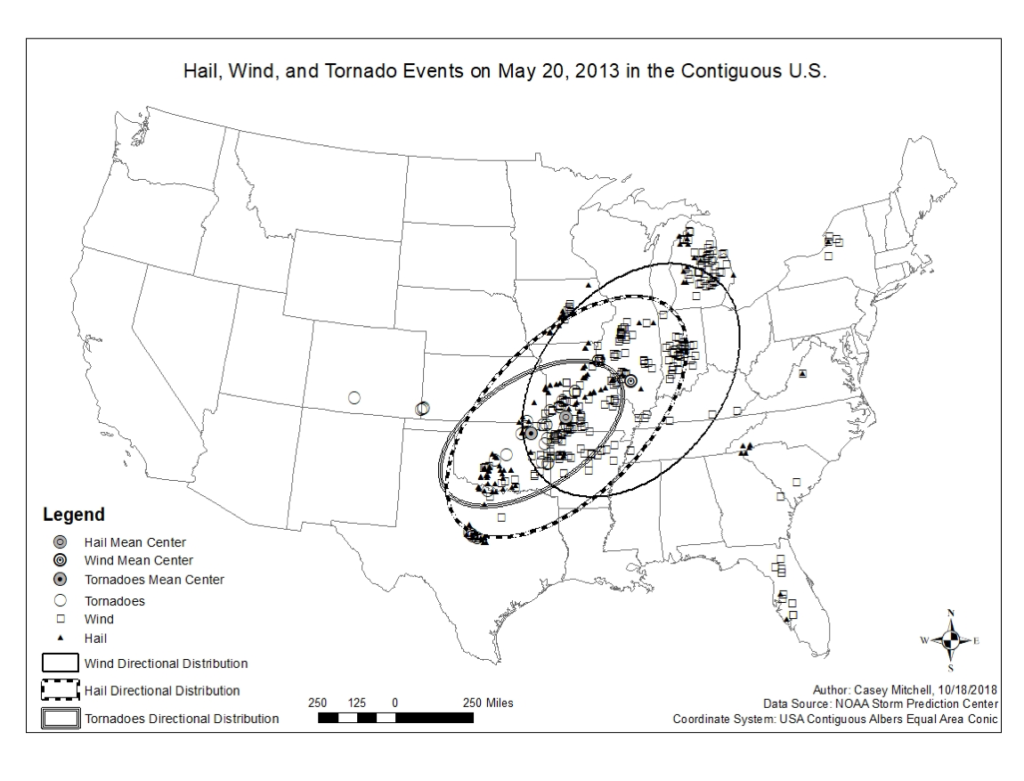
About: I created this map in ArcMap to visualize different weather events in the U.S. on a particular day for my 2018 Environmental GIS Course.
Methods: This assignment familiarized me with the “Measuring Geographic Distributions” toolset within the Spatial Statistics Toolbox, including functions such as finding the mean center of point data, and the directional distribution.