
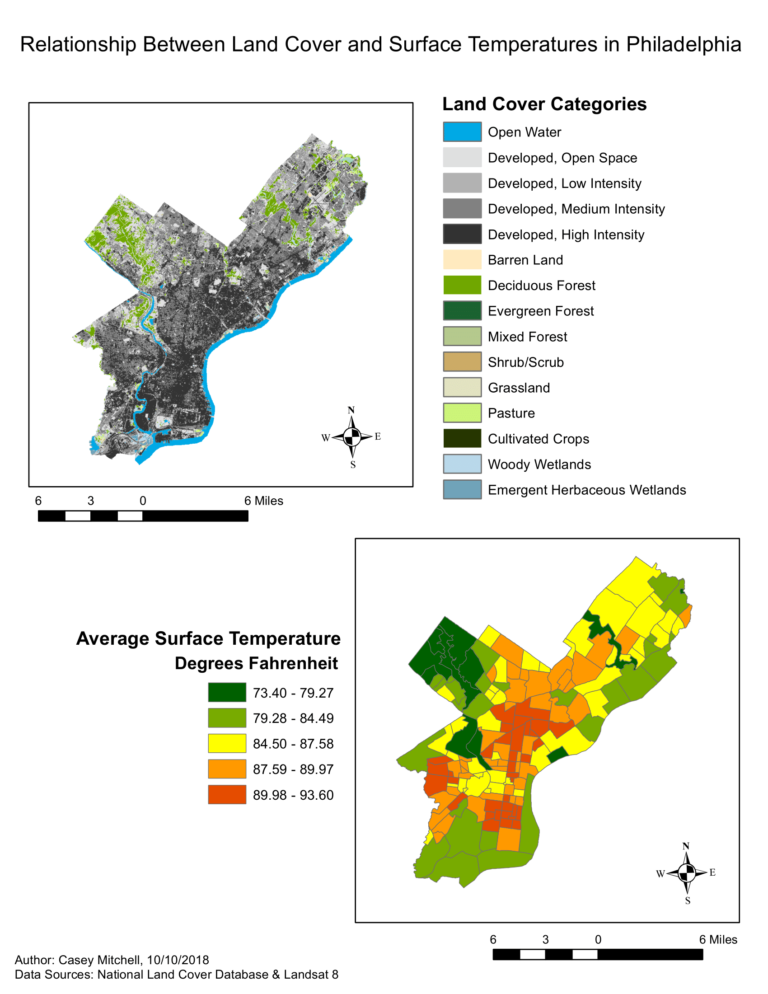
About: I created this infographic via ArcMap in my 2018 Environmental GIS course in order to compare surface temperature and land cover across the city […]
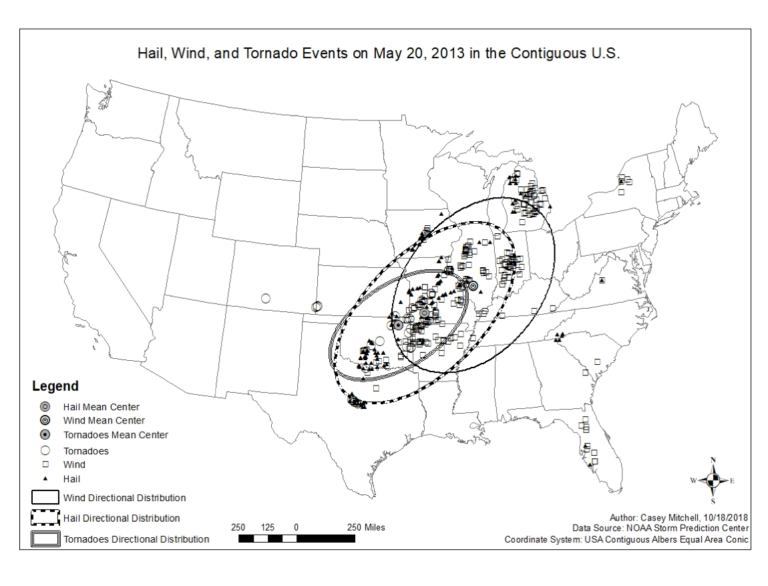
Hail, Wind, and Tornado Events on May 20, 2013
About: I created this map in ArcMap to visualize different weather events in the U.S. on a particular day for my 2018 Environmental GIS Course. […]
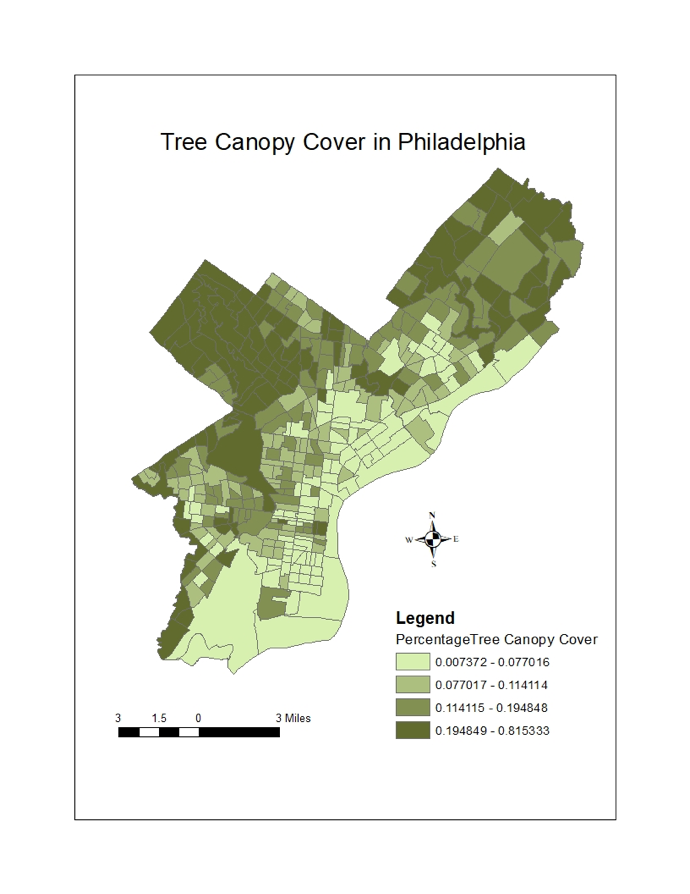
Tree Canopy Cover in Philadelphia
About: I used ArcMap to create this choropleth map displaying the percentage of land in each census tract that is covered by tree canopy in […]
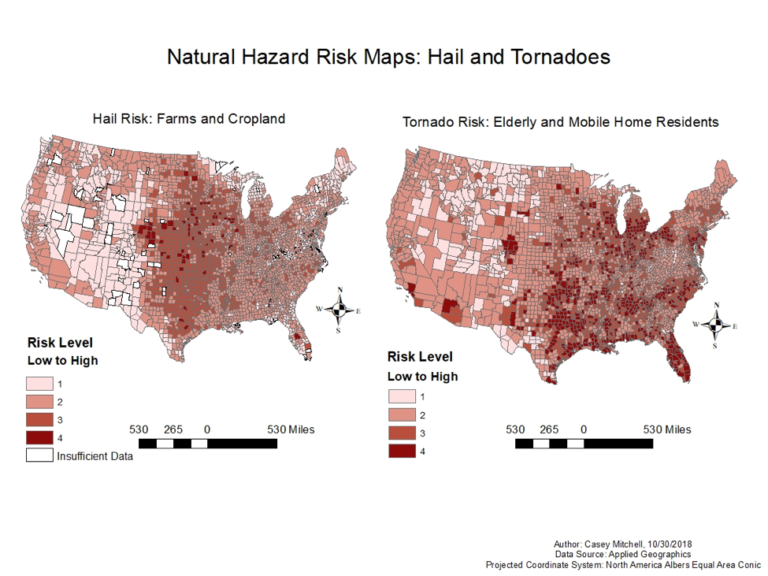
Natural Hazard Risk Maps: Hail and Tornadoes
About: I used ArcMap to create two choropleth maps displaying natural hazard vulnerability indexes in my 2019 Environmental GIS course. Each map factors one natural […]
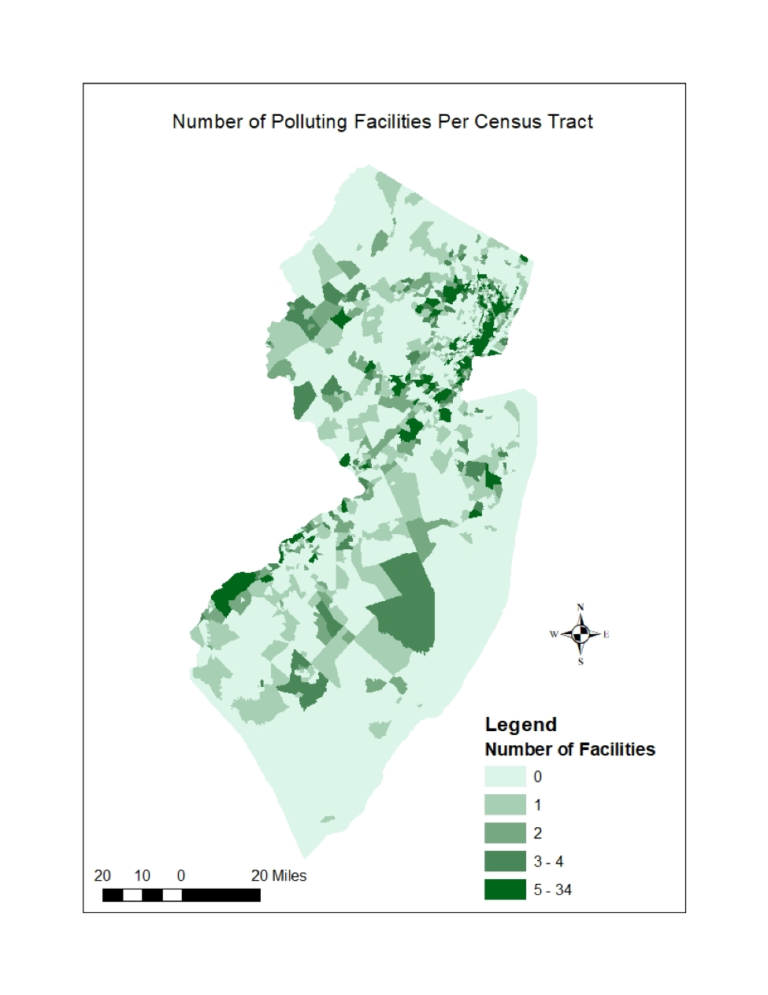
Number of Polluting Facilities Per Census Tract in New Jersey
About: I used ArcMap to create this map for my 2018 course in Urban GIS. It utilizes a simple choropleth design to show the number […]